Power BI Dashboard Portfolio

Explore live, interactive dashboards engineered for UAE companies. Every report demonstrated below features clean data modeling, optimized DAX calculation logic, and direct answers to strategic business questions.

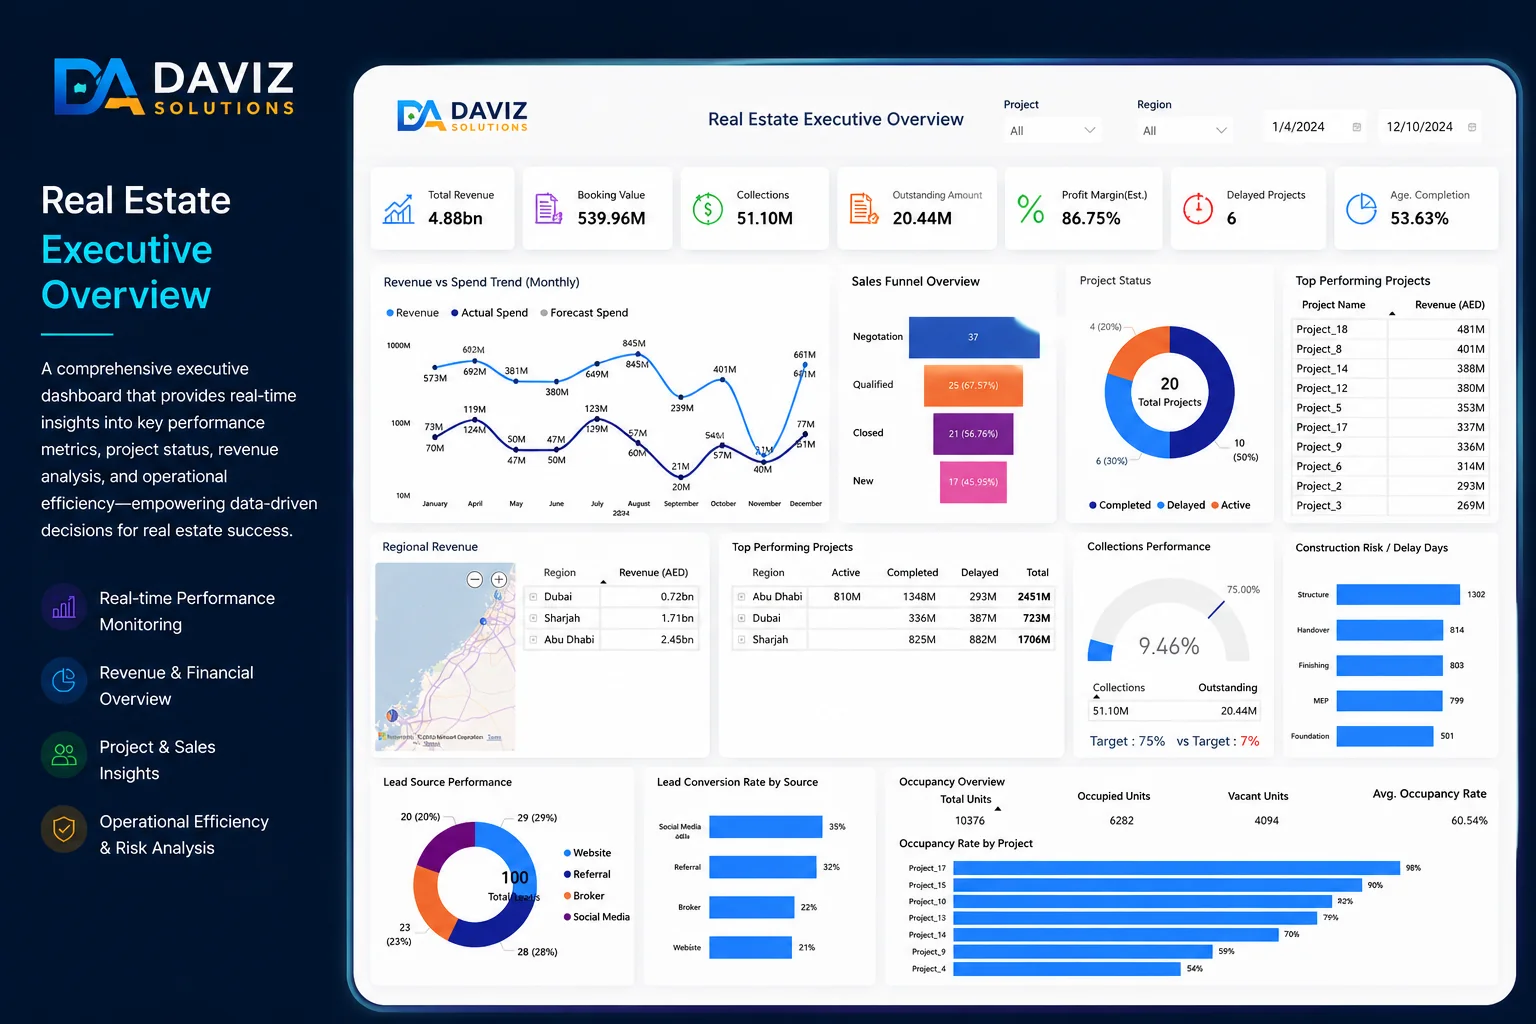
Power BI real estate management dashboard displaying occupancy rates, lease renewals, and rental collections
Real Estate

Real Estate Asset & Lease Analytics

Consolidates residential and commercial property portfolios to track occupancy levels, lease expiration schedules, payment collection velocity, and unit-level yield.

Outcome: Identified vacant unit turnaround bottlenecks, lifting annual occupancy by 6.4%.
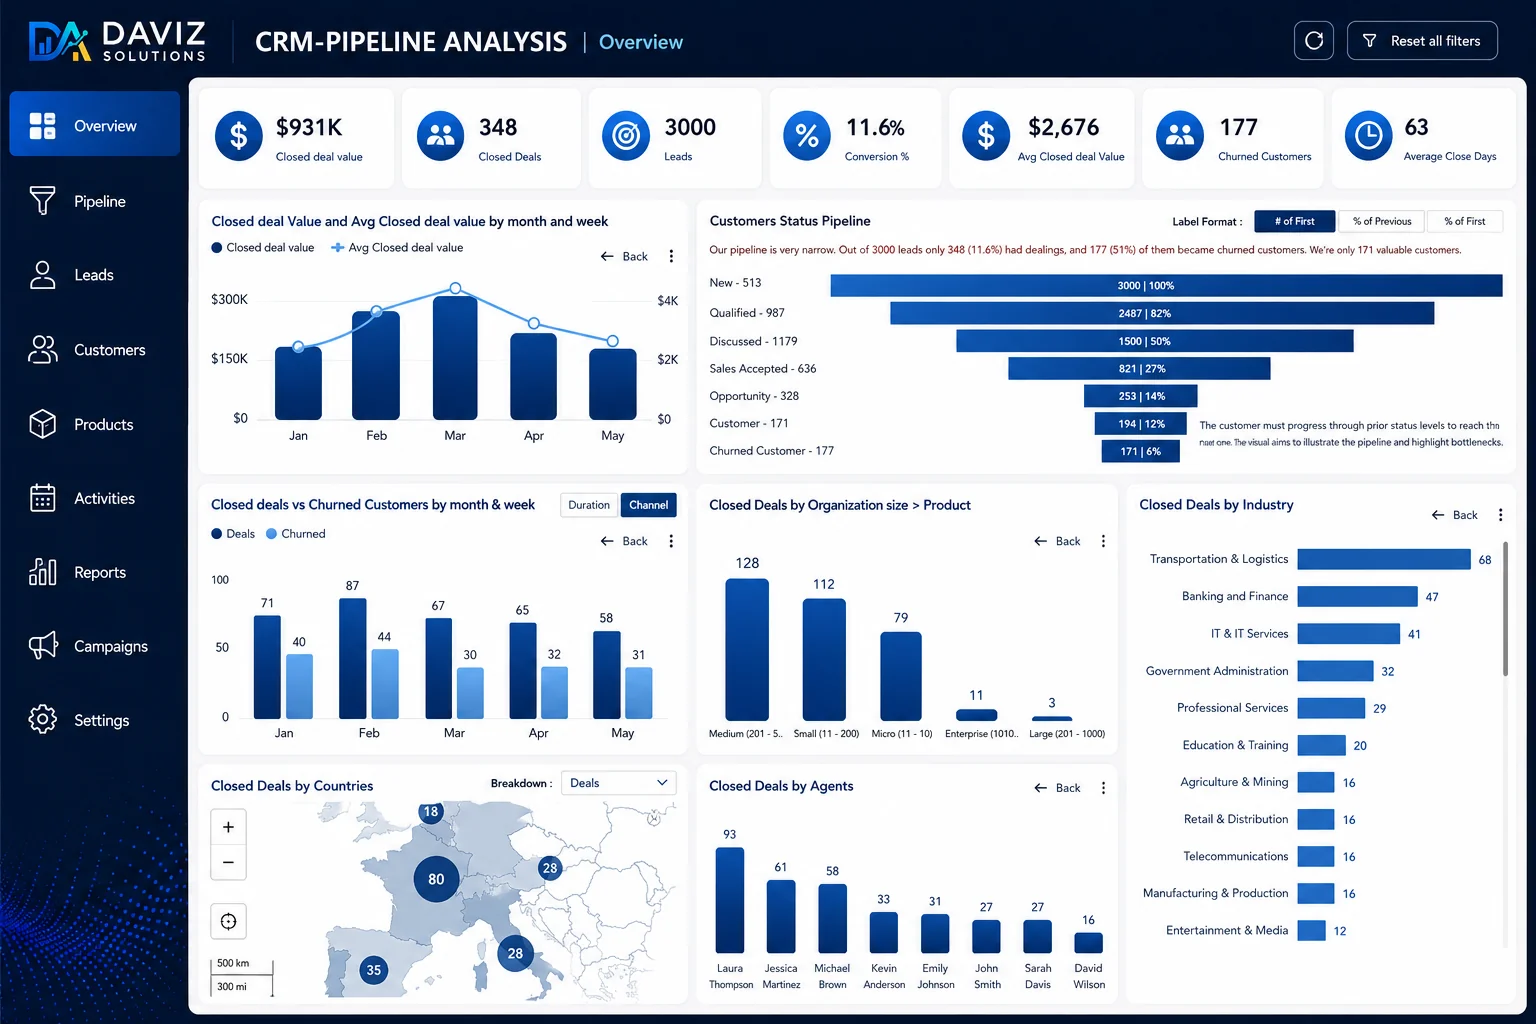
Power BI sales growth dashboard showing pipeline stages, representative quota attainment, and gross margin
Sales & Revenue

Sales Pipeline & Revenue Margin

Connects CRM deal records with ERP invoicing to analyze stage conversion velocity, sales team quota attainment, regional revenue distribution, and product margin contribution.

Outcome: Highlighted low-margin product discounting, protecting 3.8% in gross margin.
Power BI financial consolidation dashboard displaying multi-entity P&L, EBITDA, and working capital
Finance

Multi-Entity P&L & Working Capital

Automates consolidated financial reporting across multi-currency UAE operating entities, reconciling actual vs. budgeted operating expenditures, cash reserves, and EBITDA.

Outcome: Reduced month-end management reporting consolidation time from 6 days to 4 hours.
Operations performance dashboard showing service request resolution times, team throughput, and SLA compliance
Operations

Operations Throughput & SLA Tracking

Monitors service ticket resolution times, work-order queues, asset utilization rates, and operational SLA compliance across multiple facilities.

Outcome: Reduced unresolved customer service backlog by 31% within 60 days.
Logistics and supply chain dashboard showing on-time delivery rates, fuel consumption, and vehicle maintenance
Operations & Logistics

Fleet Dispatch & Route Efficiency

Combines telematics GPS tracking with ERP delivery manifests to track driver trip duration, idle fuel burn, delivery completion rates, and scheduled maintenance windows.

Outcome: Fleet on-time delivery SLA compliance increased from 82% to 94.5%.
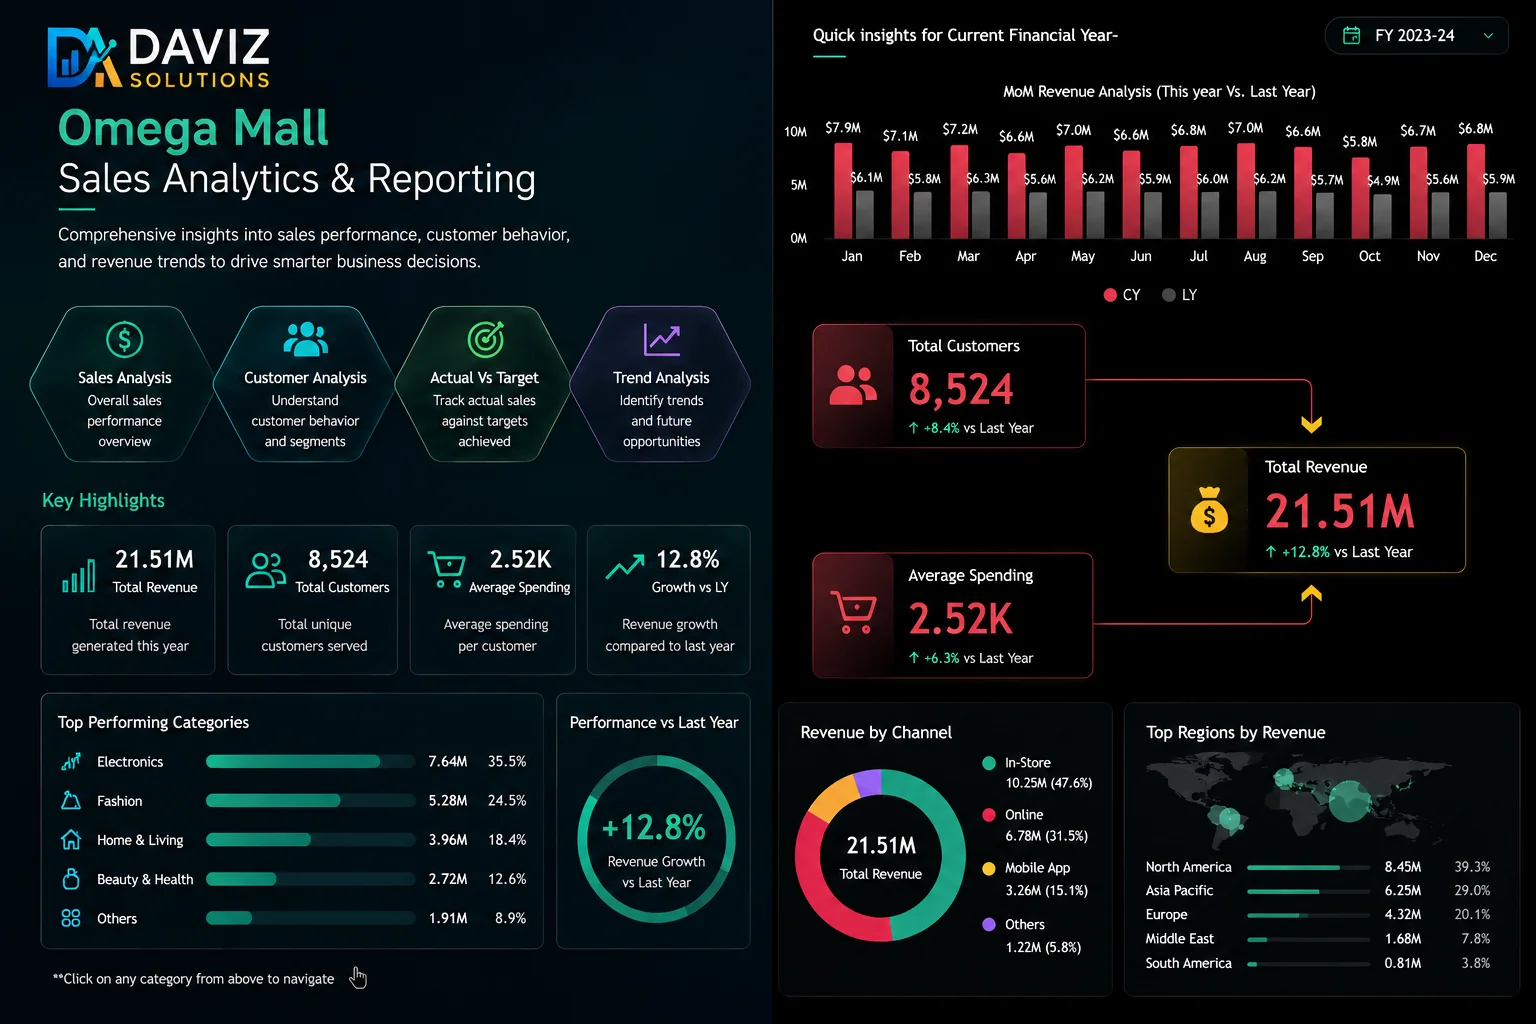
Retail store analytics dashboard showing revenue by branch, basket size, and inventory aging
Retail & Hospitality

Omnichannel Retail Sales & Stock Turnover

Aggregates point-of-sale data with online e-commerce channels to track average basket size, fast vs. slow-moving stock keeping units (SKUs), and store footfall conversion.

Outcome: Improved inventory turnover by 18% through automated slow-stock alerts.
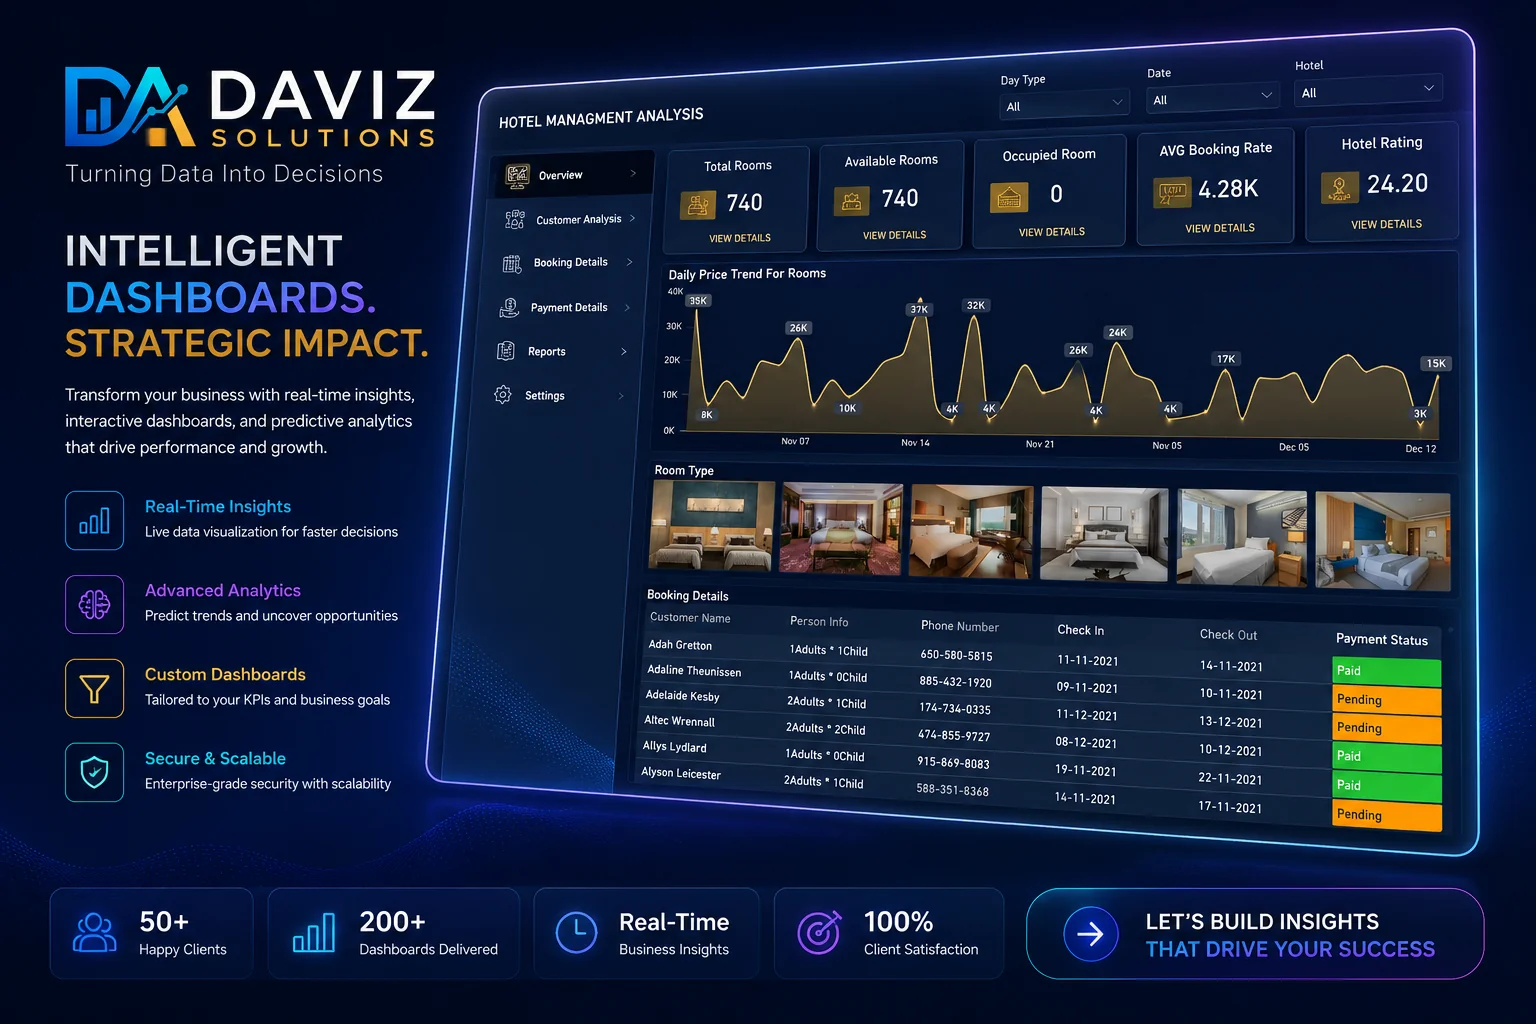
Hospitality executive dashboard displaying RevPAR, ADR, and guest satisfaction scores
Retail & Hospitality

Hotel RevPAR & Guest Experience

Tracks hotel property management system (PMS) performance: Revenue per Available Room (RevPAR), Average Daily Rate (ADR), direct vs. OTA booking share, and F&B outlet margins.

Outcome: Direct website booking share increased by 14%, saving substantial OTA commissions.
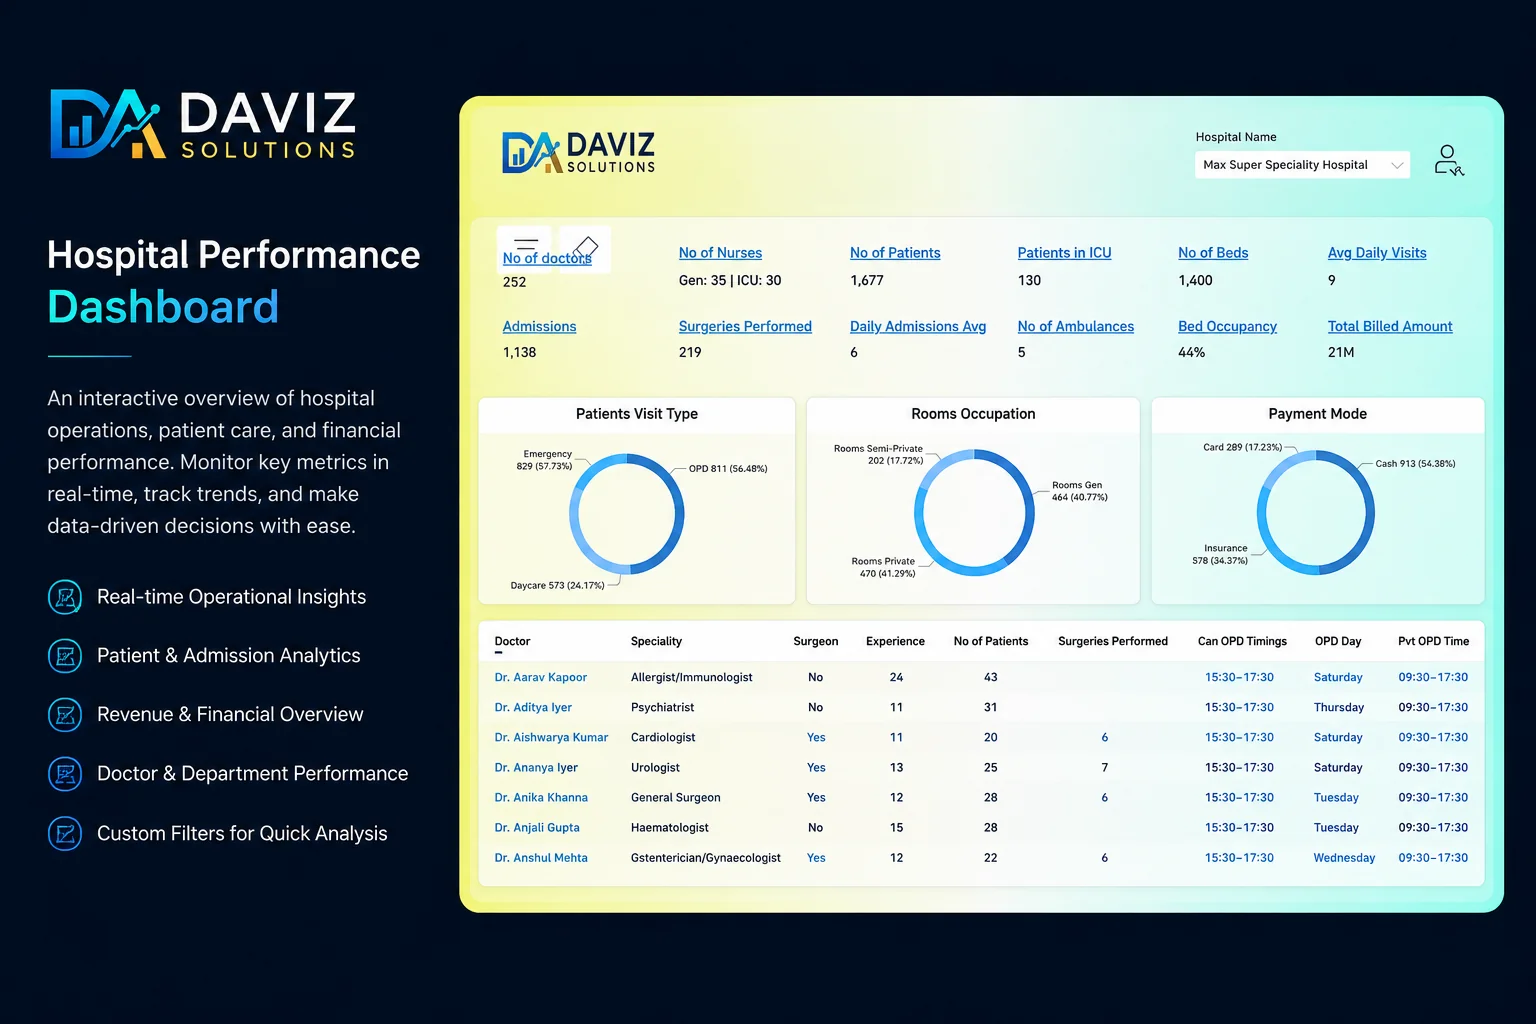
Healthcare clinic operations dashboard displaying patient wait times, bed occupancy, and physician productivity
Healthcare

Clinic Patient Flow & Resource Utilization

Integrates electronic medical records (EMR) with appointment scheduling to evaluate patient door-to-doctor times, diagnostic equipment utilization, and insurance claim approvals.

Outcome: Average outpatient patient wait time decreased by 22 minutes per visit.
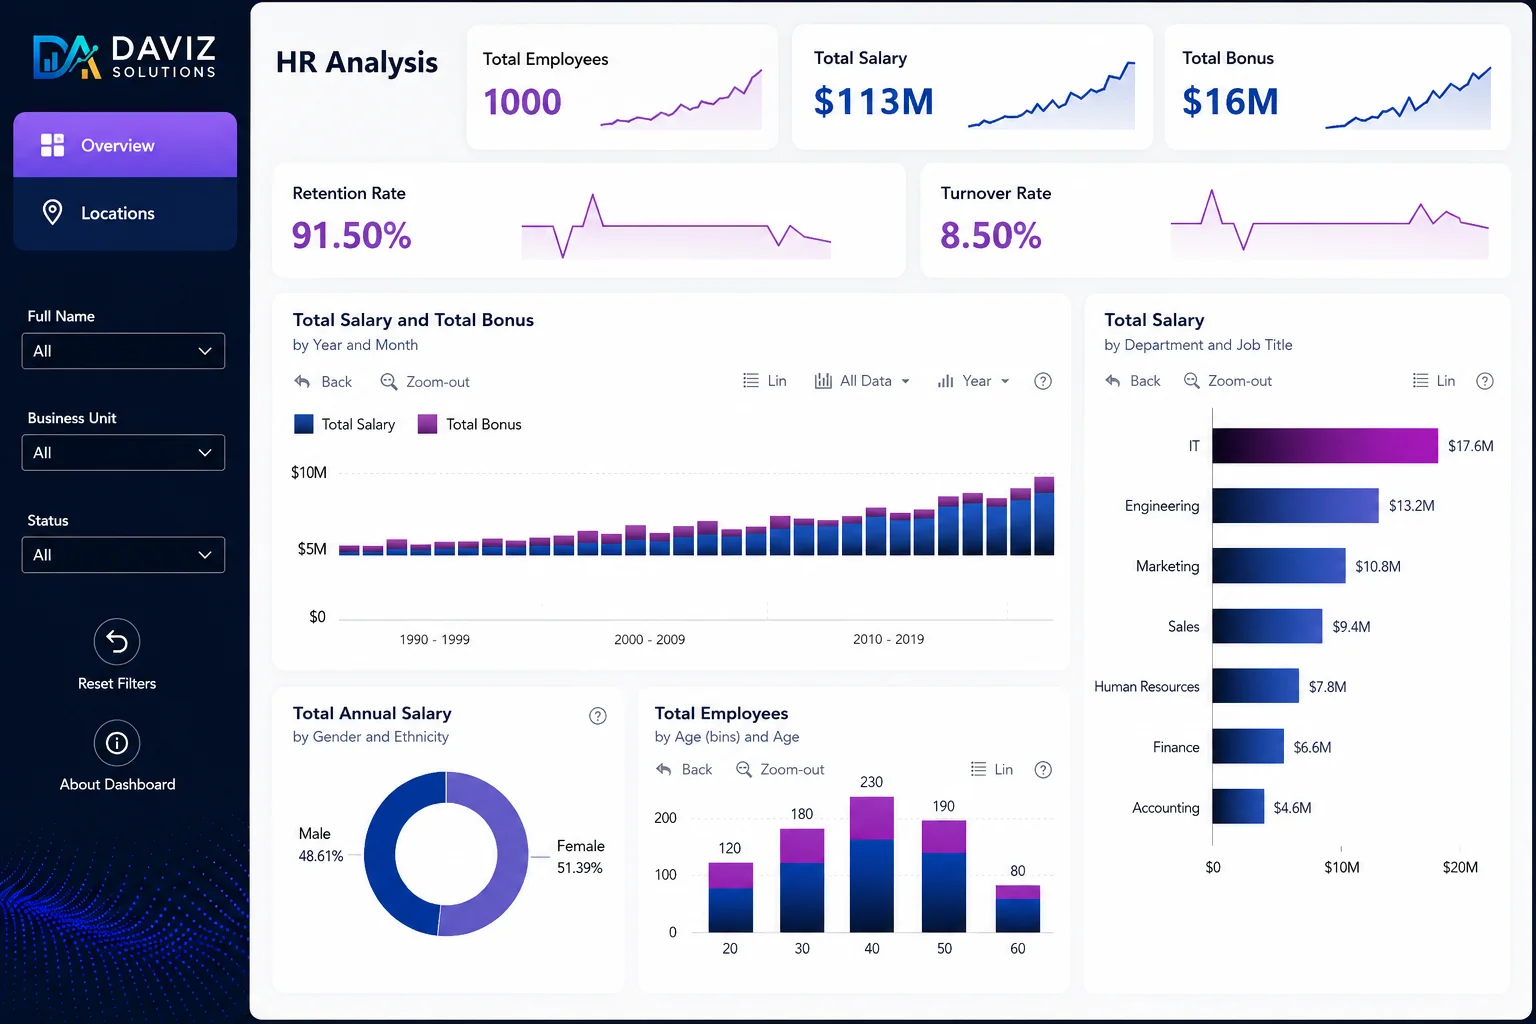
Human resources analytics dashboard showing headcount turnover, recruitment velocity, and payroll expense
HR & Workforce

Workforce Retention & Headcount Analytics

Tracks employee turnover risk, departmental headcount growth, recruitment cycle duration, and payroll cost trends across UAE operating business units.

Outcome: Identified critical department retention risks 90 days prior to typical resignation cycles.
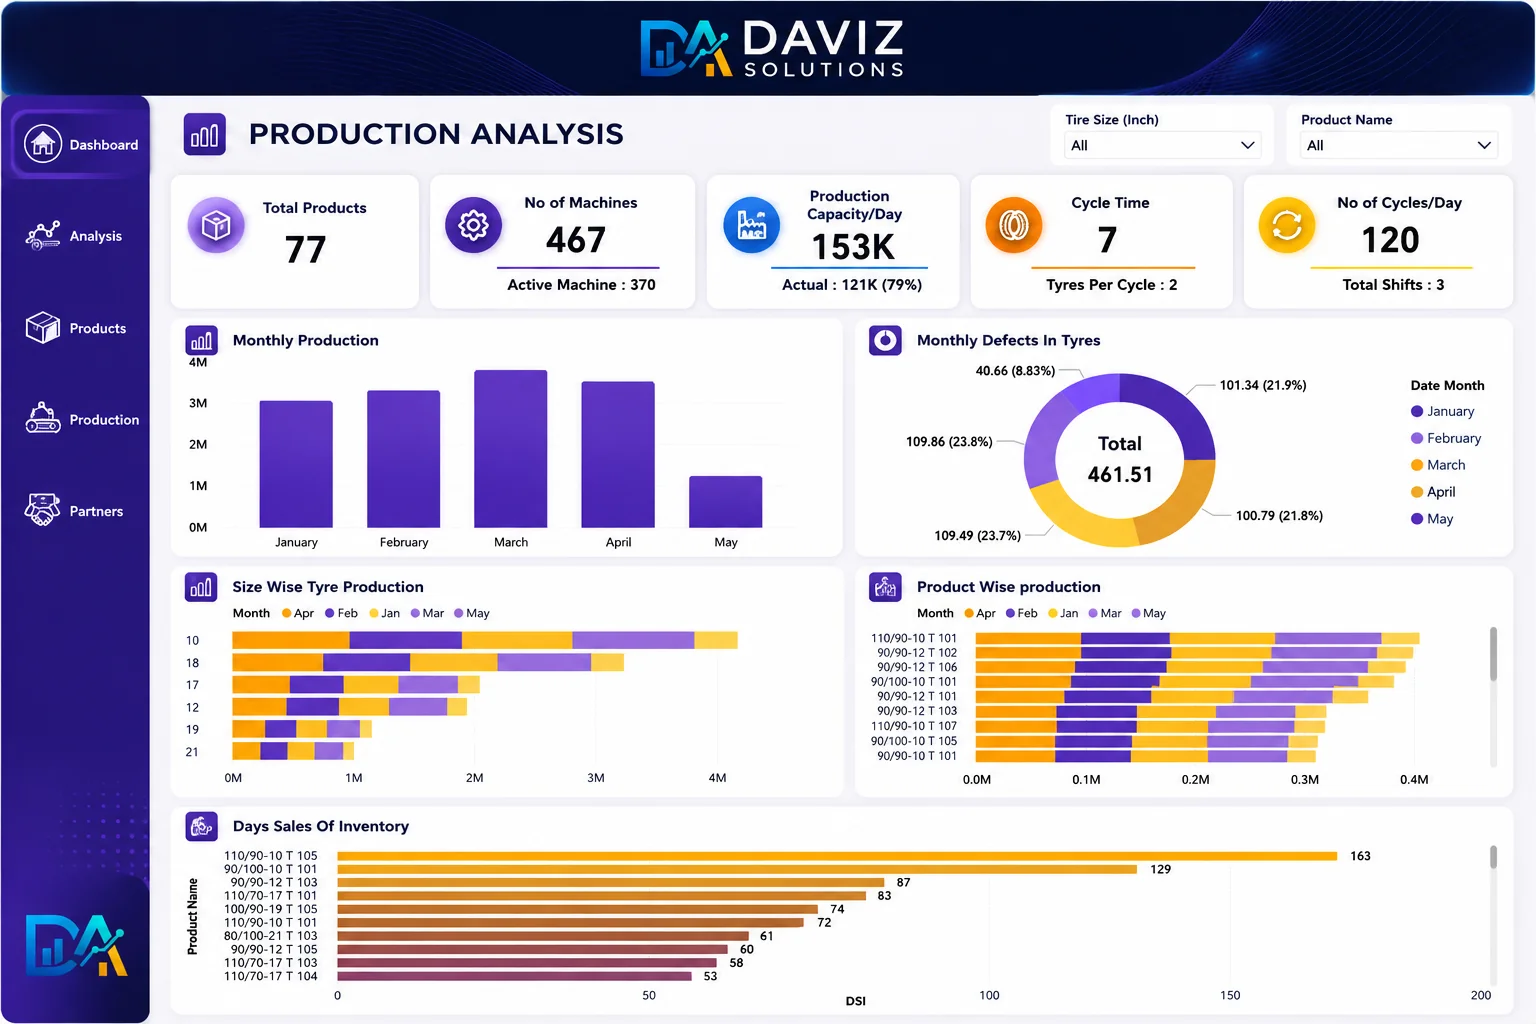
Manufacturing plant dashboard showing overall equipment effectiveness OEE, scrap rates, and machine downtime
Manufacturing

Plant OEE & Production Quality Control

Monitors shop floor machine telemetry, Overall Equipment Effectiveness (OEE), scrap waste percentages, and planned vs. unplanned machine maintenance downtime.

Outcome: Factory floor unplanned machine downtime decreased by 15.2%.