Enterprise Architectures for 9 Core Verticals.
Generic IT dashboards fail because they lack industry context. We combine deep domain understanding with Microsoft Fabric engineering to deliver sector-specific data models, KPI calculations, and operational decision applications.
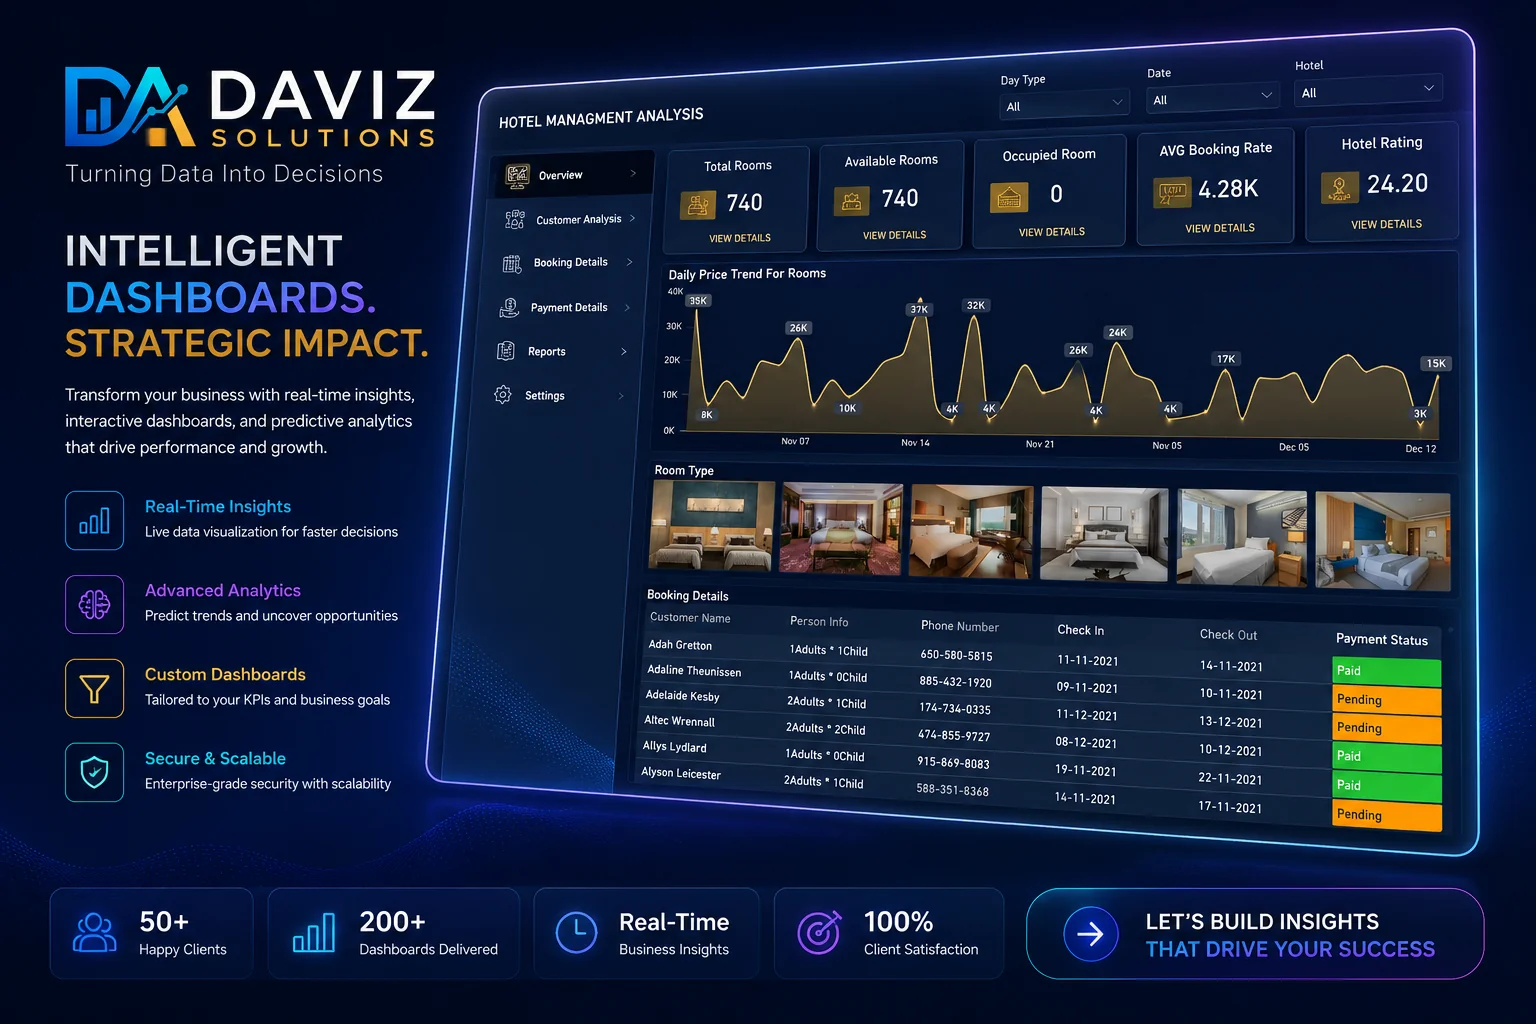
Hospitality & Hotel Portfolios
Common Data Challenges: Fragmented property management systems (Opera, Protel), third-party OTA channel manager logs, disparate restaurant POS feeds, and delayed month-end revenue auditing.
- Relevant Business KPIs: RevPAR, ADR, Occupancy %, TrevPAR, F&B Revenue Mix, Channel Acquisition Cost.
- Typical Source Systems: Oracle Opera PMS, Infrasys / Micros POS, SiteMinder, HotSOS, SAP Finance.
- Operational Value: Automated daily yield optimization, dynamic OTA commission management, and real-time room availability.
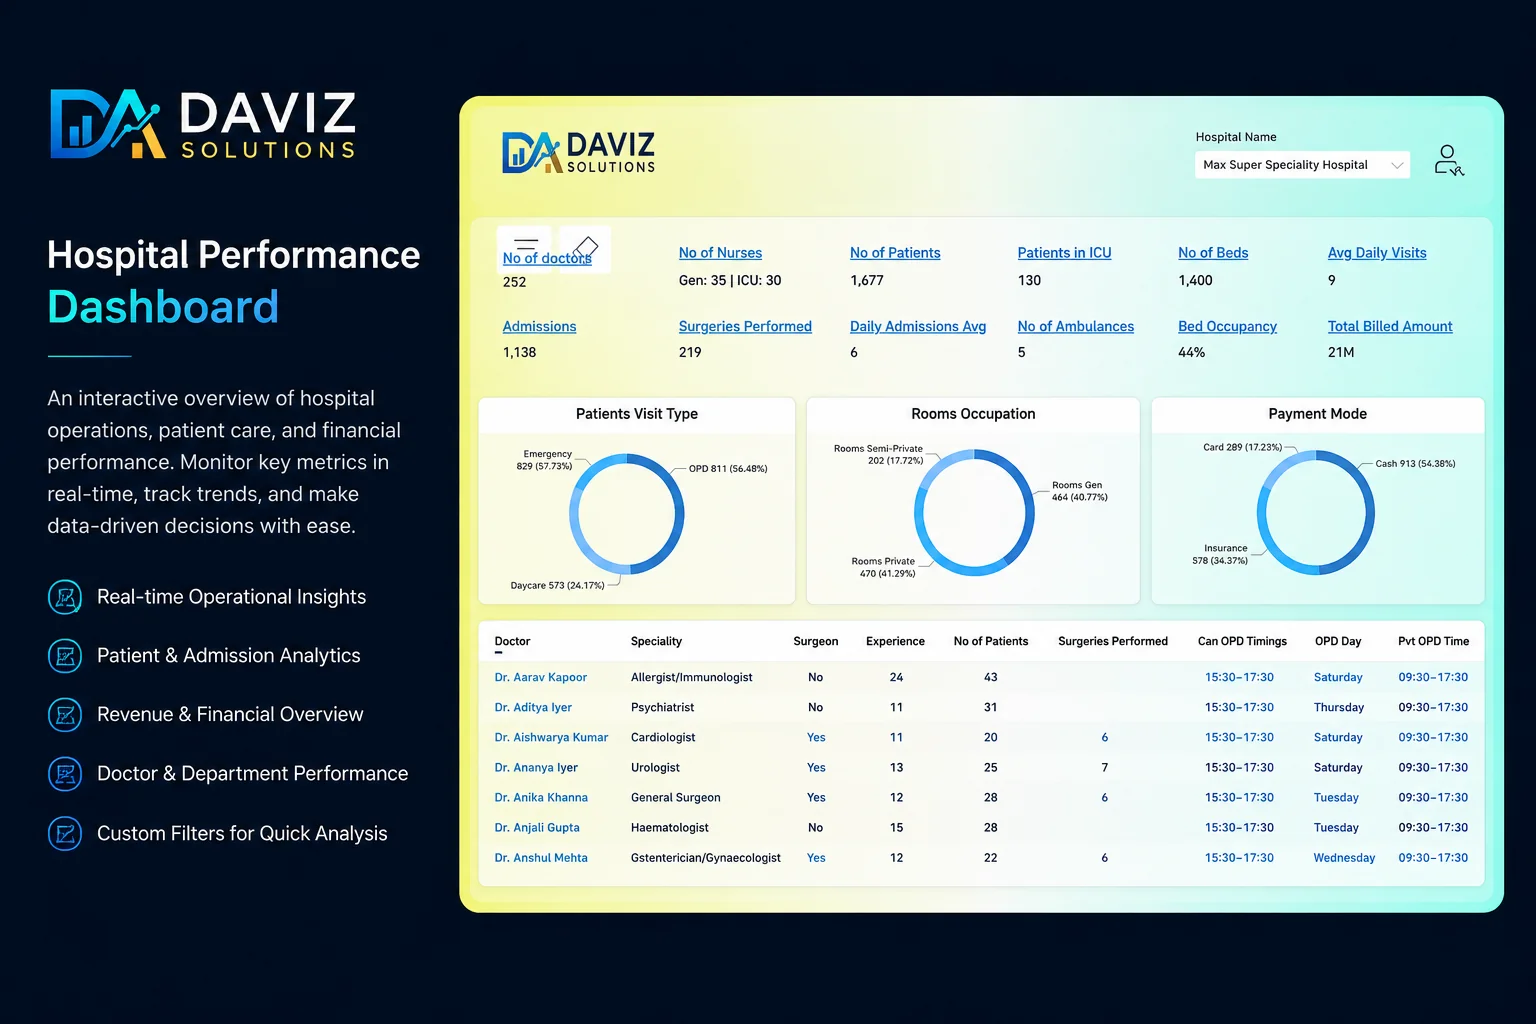
Healthcare & Hospitals
Common Data Challenges: Segregated Electronic Health Records (EHR), legacy billing silos, strict patient data privacy compliance (HIPAA/NABIDH), and uncoordinated bed dispatch workflows.
- Relevant Business KPIs: Bed Occupancy %, Average Length of Stay (ALOS), ER Door-to-Doctor, Revenue Cycle Days, Claim Denial Rate.
- Typical Source Systems: Epic, Cerner, Malaffi/NABIDH exchange, SAP Healthcare, Laboratory Information Systems (LIS).
- Operational Value: Real-time bed dispatch coordination, reduced claim denials, and clinical quality compliance.
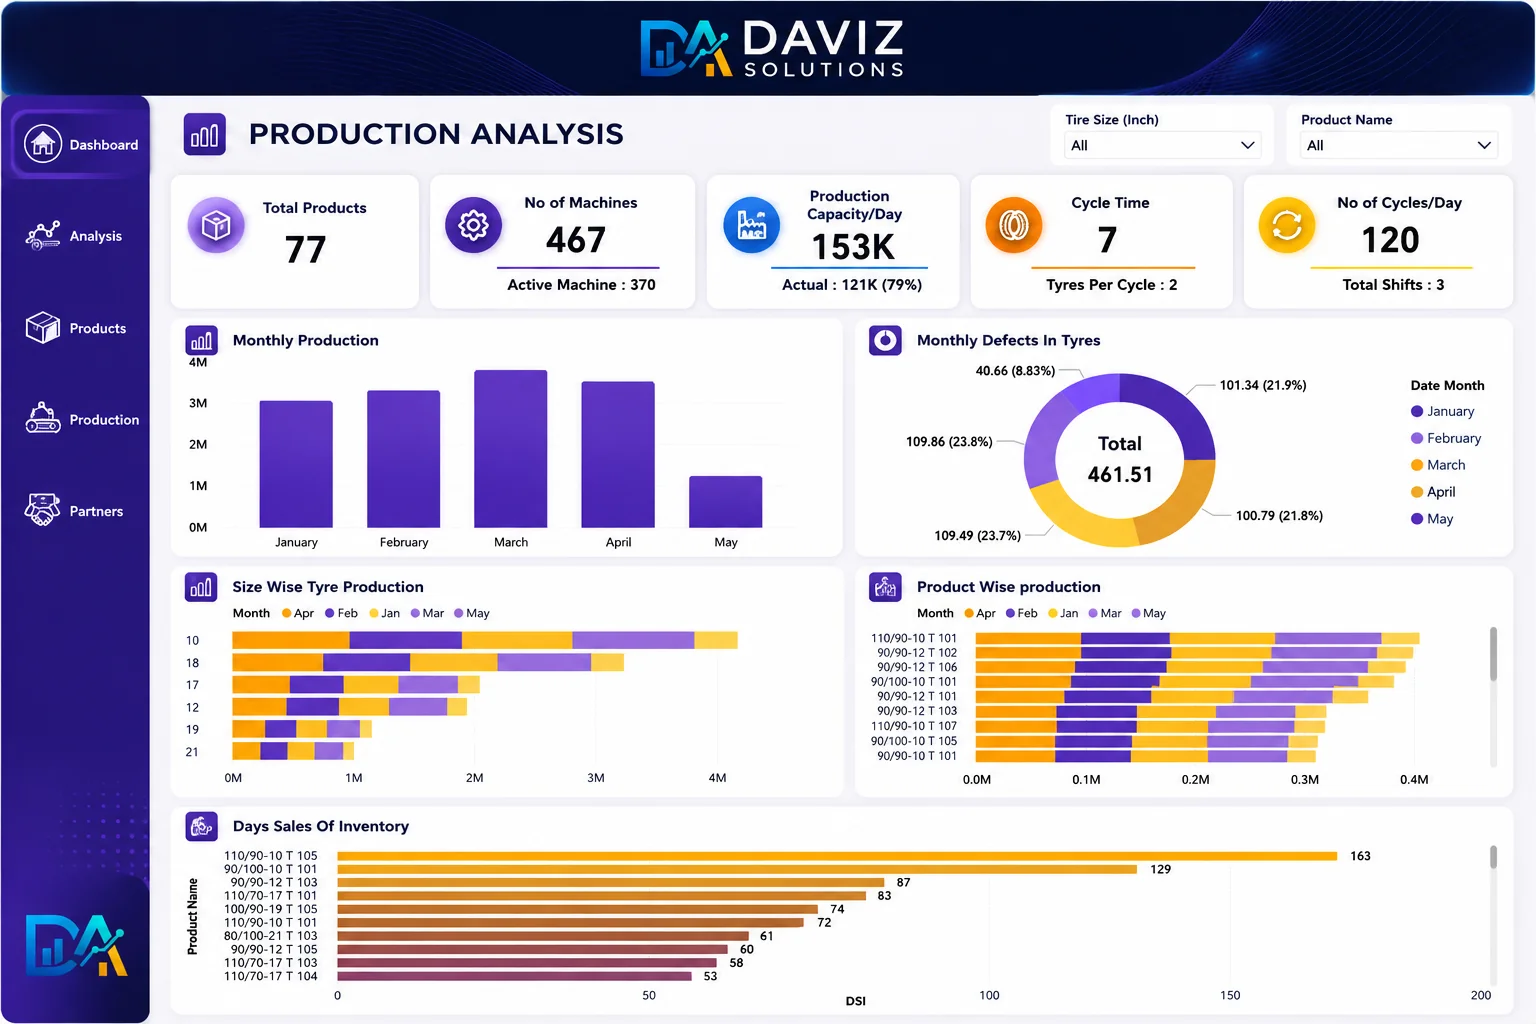
Manufacturing & Industrial Production
Common Data Challenges: Plant floor SCADA/PLC historians disconnected from ERP bill-of-materials (BOM), manual scrap recording, and unplanned machine breakdowns.
- Relevant Business KPIs: Overall Equipment Effectiveness (OEE), Scrap %, Mean Time Between Failures (MTBF), Production Schedule Attainment.
- Typical Source Systems: Siemens/Wonderware SCADA, Rockwell MES, SAP S/4HANA PP/MM, Maintenance CMMS.
- Operational Value: Sub-minute downtime root cause alerting, proactive maintenance scheduling, and verified unit margin calculations.
Retail & FMCG Brands
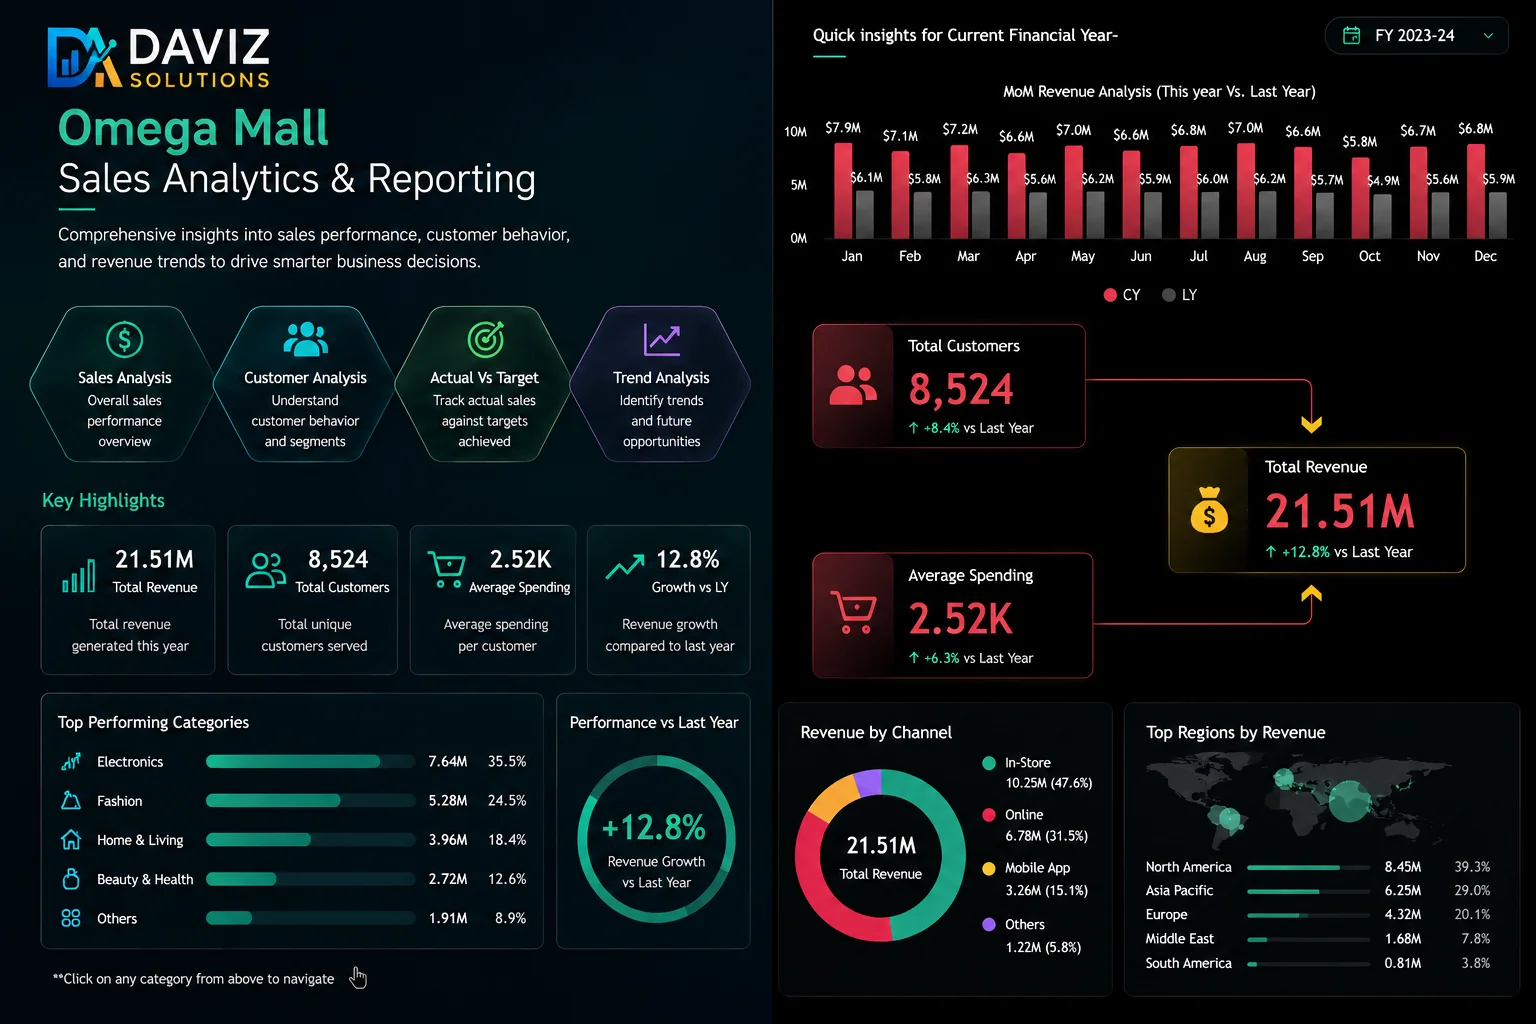
Common Data Challenges: Reconciling omnichannel physical store POS receipts with e-commerce marketplaces, managing stockouts on high-velocity items, and delayed markdown tracking.
- Relevant Business KPIs: Sell-Through Rate %, Inventory Turnover, GMROI, Average Basket Size, Stockout Rate.
- Typical Source Systems: Oracle Retail, NCR POS, Shopify Plus, SAP MM/SD, Blue Yonder WMS.
- Operational Value: Real-time replenishment alerts, margin optimization per product category, and dead-stock mitigation.
Logistics & Supply Chain
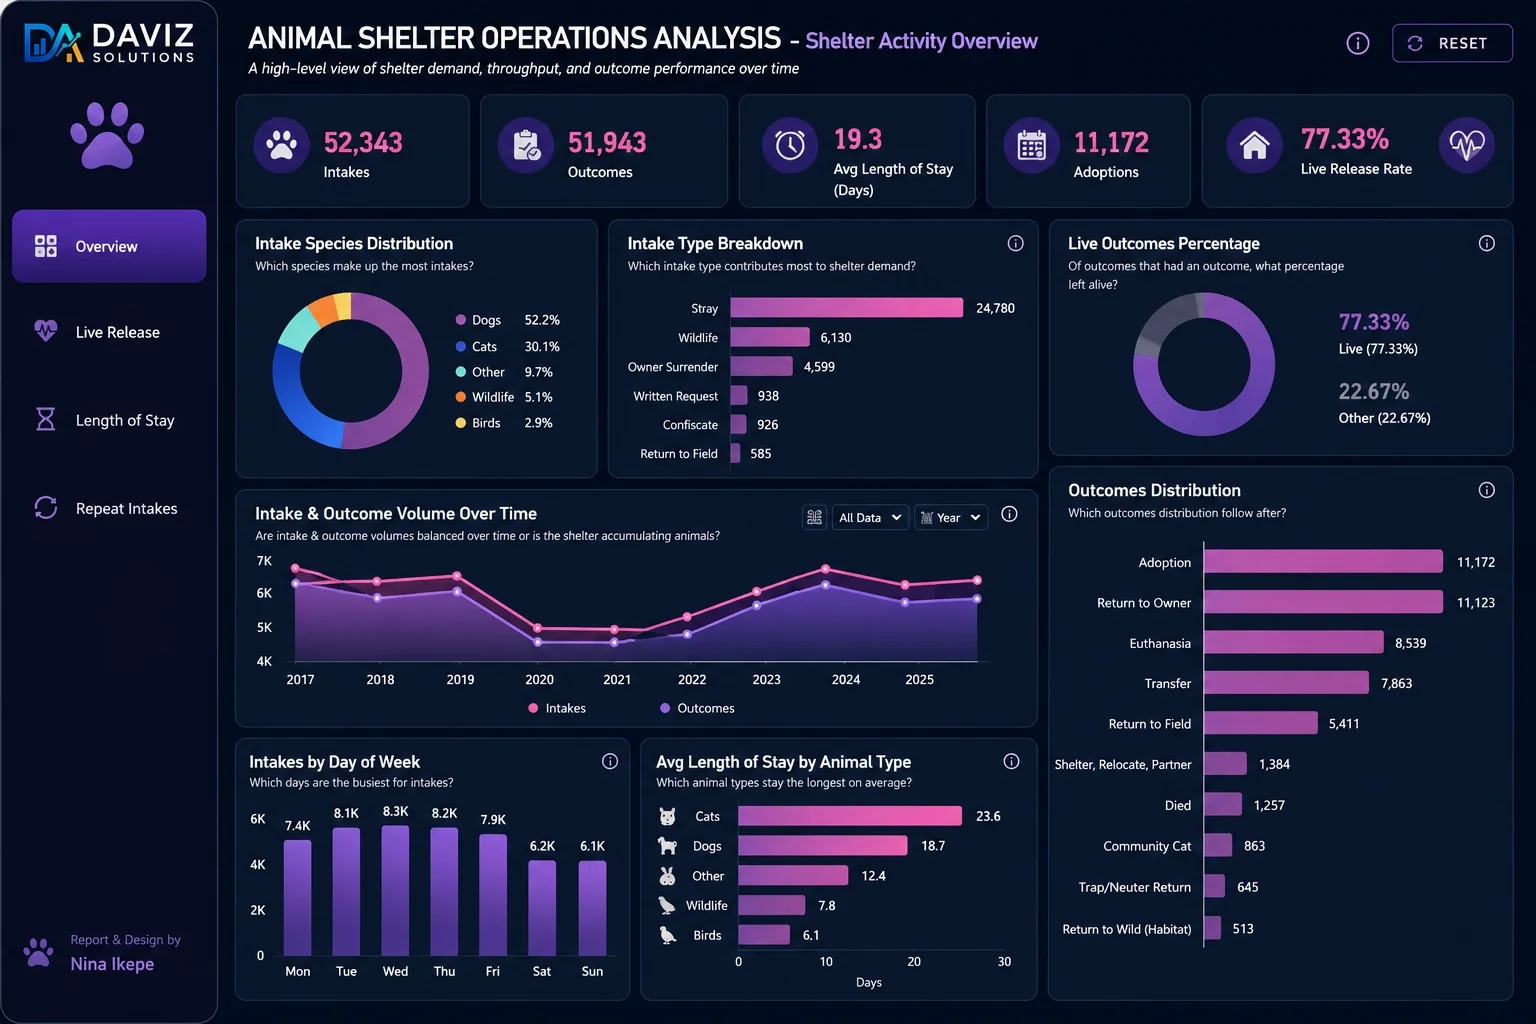
Common Data Challenges: Multi-carrier tracking gaps, telematics data volume overloads, unverified demurrage charges, and inaccurate freight invoice reconciliations.
- Relevant Business KPIs: On-Time In-Full (OTIF), Fleet Utilization %, Cost per Ton-Kilometer, Dwell Time, Freight Cost Variance.
- Typical Source Systems: Manhattan Associates WMS, Oracle Transportation Management (OTM), Geotab Telematics, SAP LE/TM.
- Operational Value: Live shipment ETA accuracy, fuel consumption variance detection, and automated freight audit reconciliation.
Oil & Gas / Energy
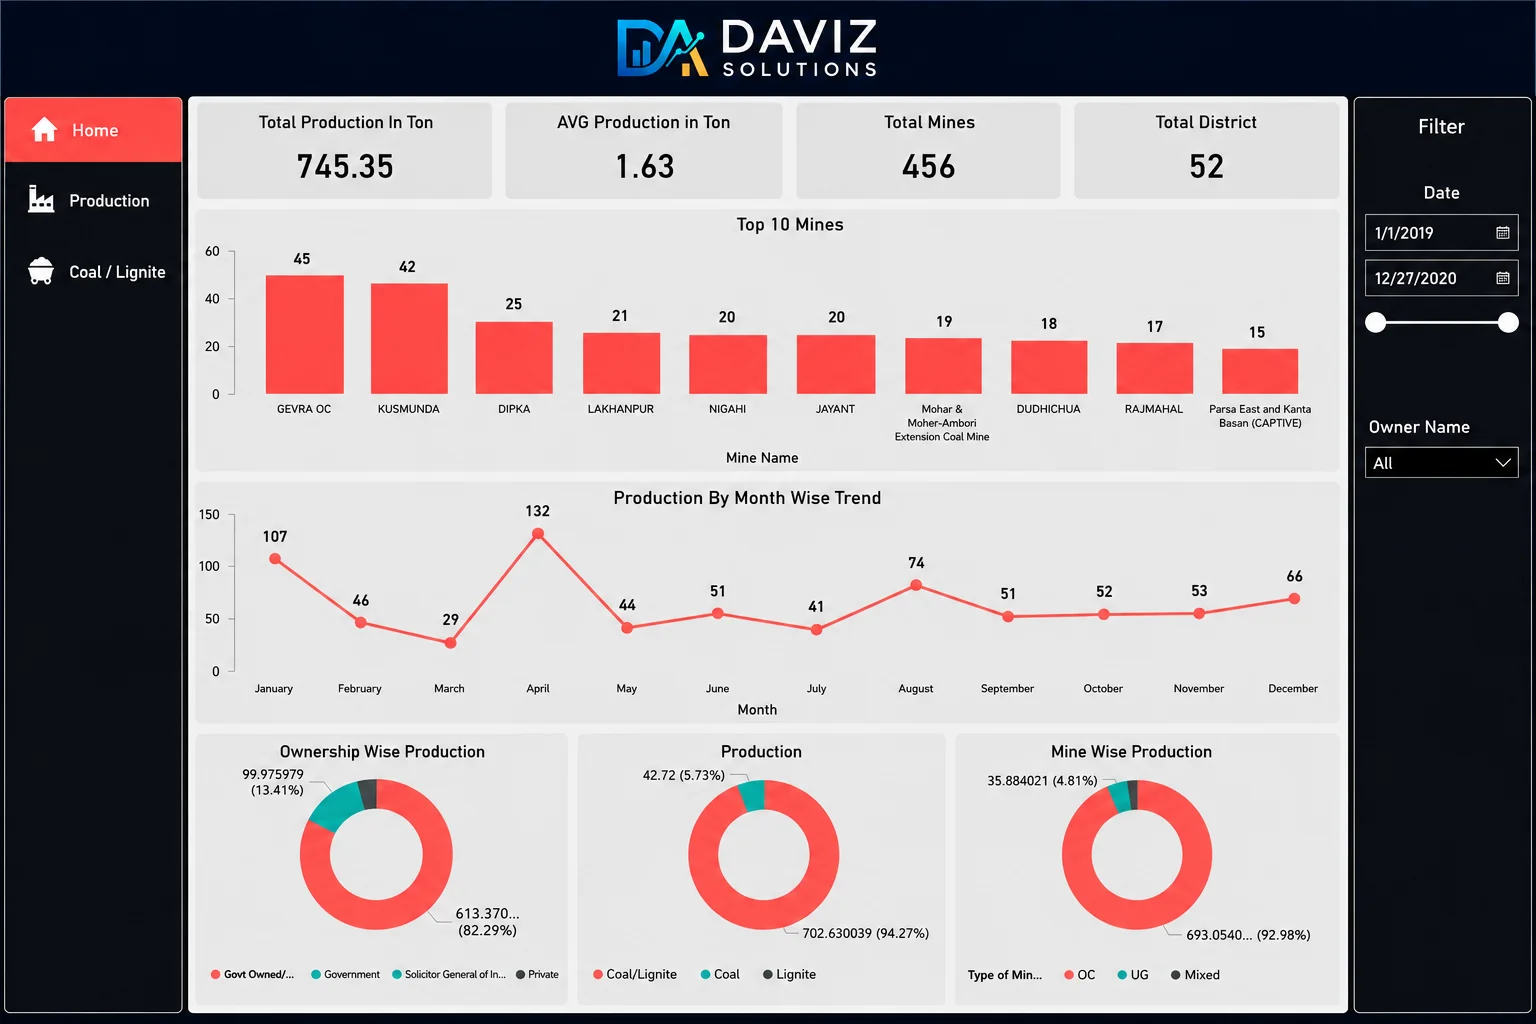
Common Data Challenges: Remote field SCADA connections, high-frequency IoT sensor telemetry, disparate maintenance work orders, and strict HSE regulatory reporting requirements.
- Relevant Business KPIs: Daily BOE Output, Facility Uptime %, Flaring Volume, Lifting Cost per Barrel, HSE Incident Severity.
- Typical Source Systems: OSIsoft PI Historian, Maximo Asset Management, SAP PM/MM, Field Telemetry Gateways.
- Operational Value: Real-time production optimization, automated environmental compliance audits, and critical equipment health index.
Banking & Financial Services
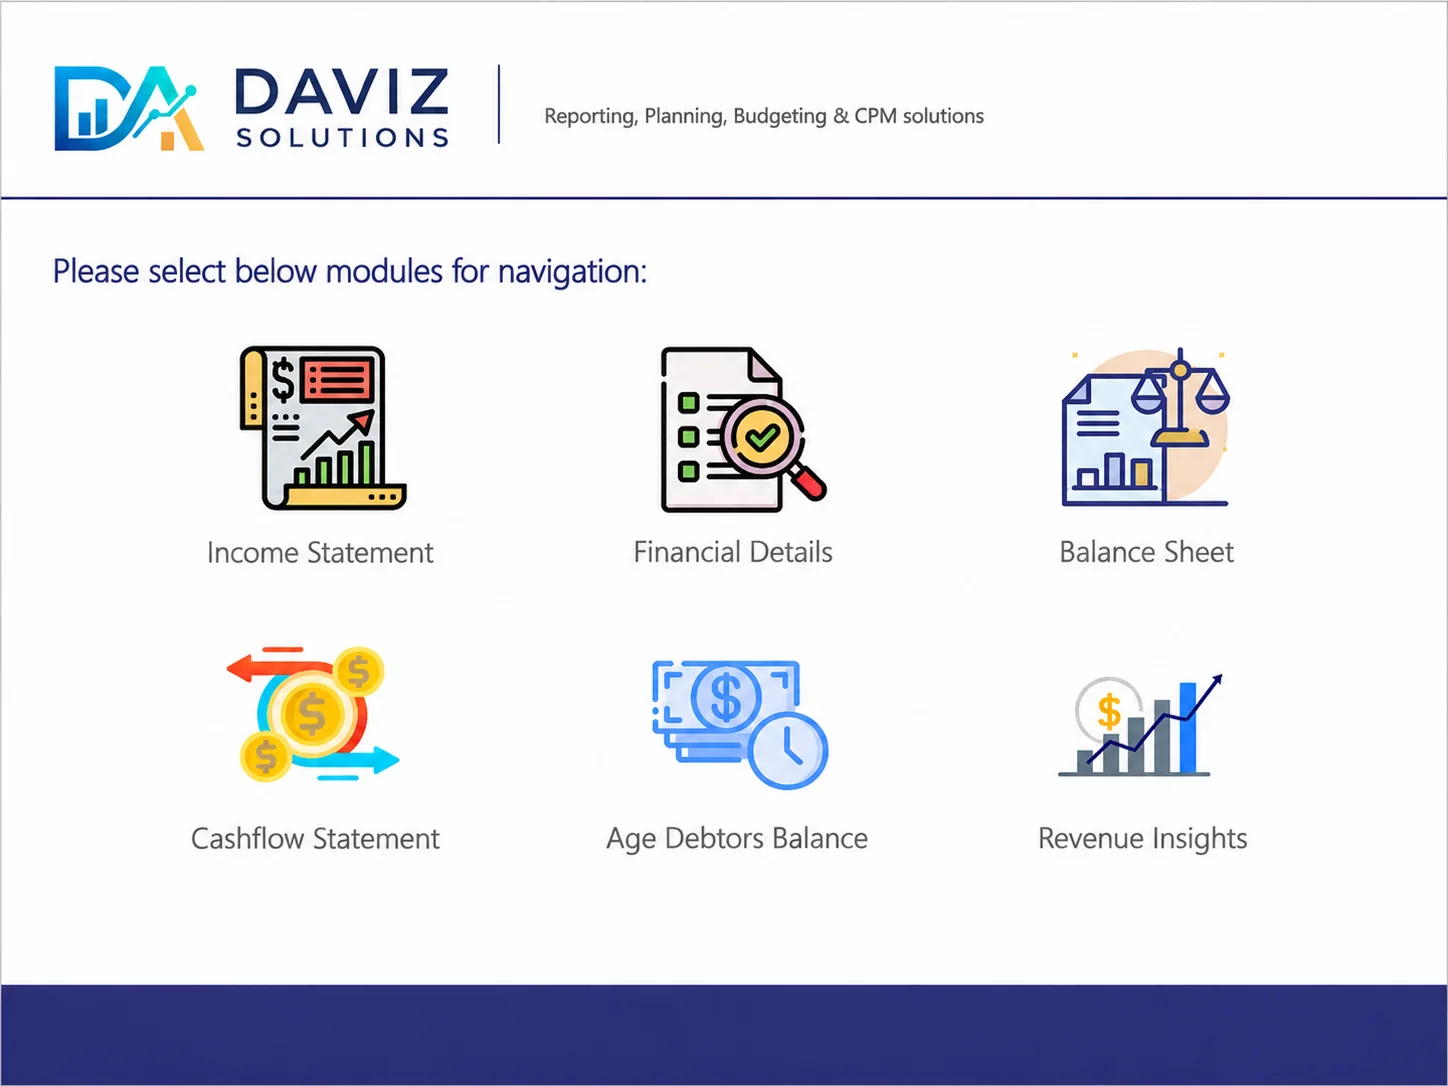
Common Data Challenges: Legacy core banking platforms, distributed loan origination databases, central bank regulatory reporting deadlines, and AML transaction monitoring latency.
- Relevant Business KPIs: Net Interest Margin (NIM), Non-Performing Loan (NPL) Ratio, Liquidity Coverage (LCR), Cost-to-Income, Capital Adequacy.
- Typical Source Systems: Finacle / Temenos Core, Calypso Treasury, SAS AML, SAP Financials.
- Operational Value: Automated central bank regulatory reports, live treasury liquidity simulation, and portfolio credit risk oversight.
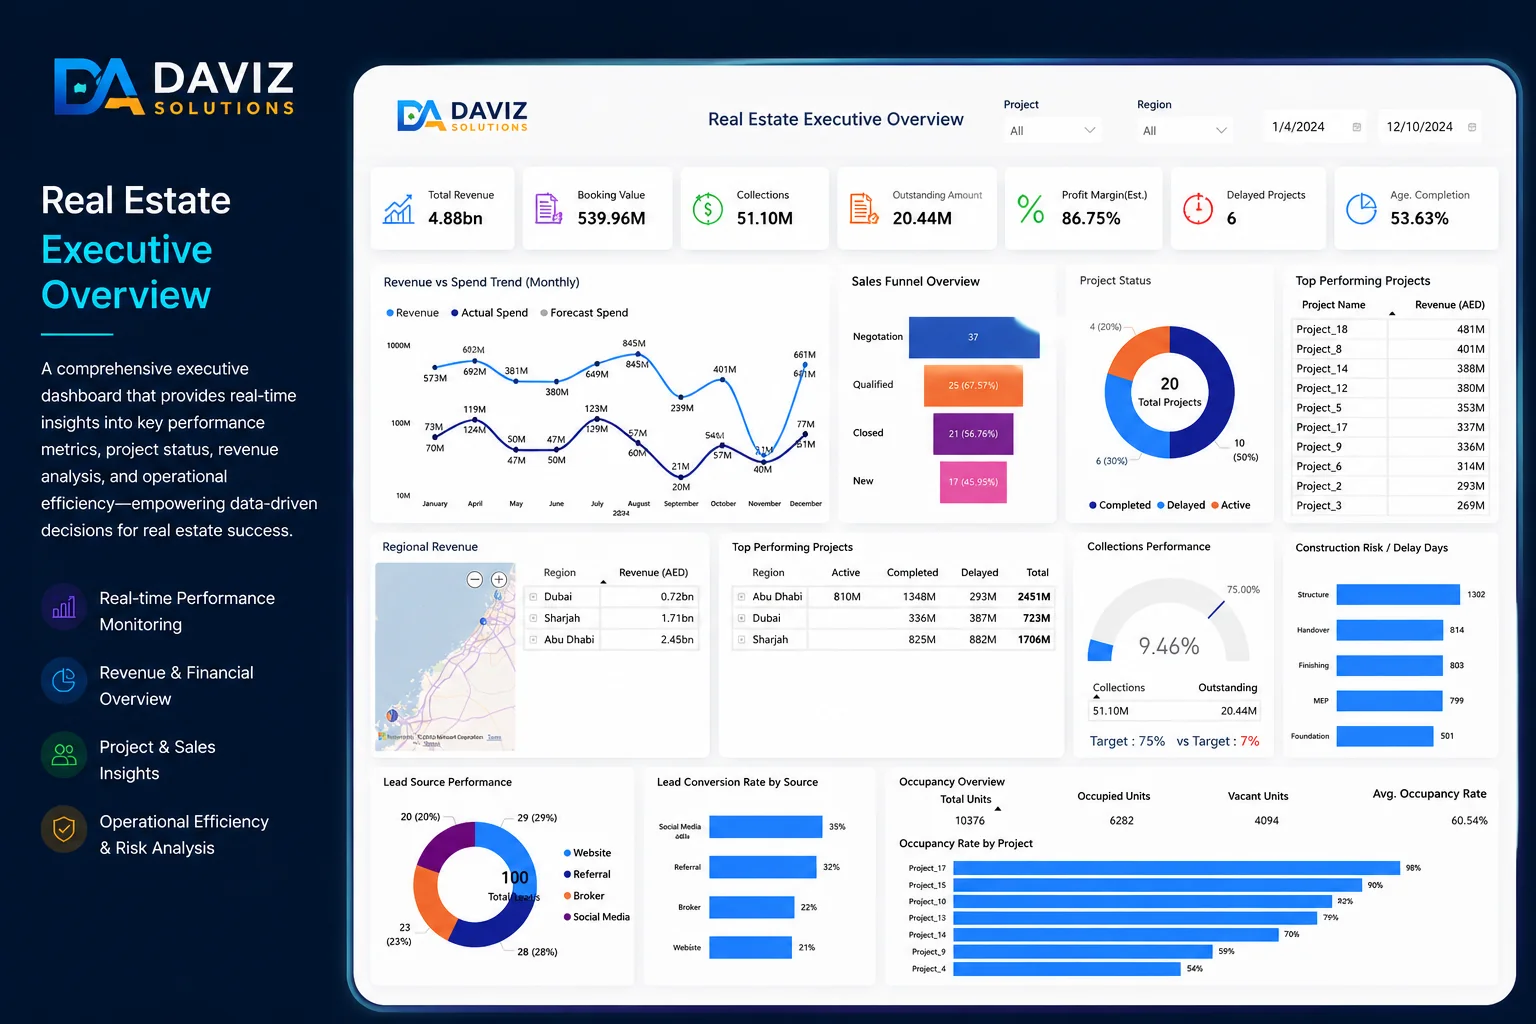
Real Estate & Property Portfolios
Common Data Challenges: Multi-developer portfolio tracking, lease renewal lag, manual rental collection reconciliations, and facility maintenance cost variances across properties.
- Relevant Business KPIs: Portfolio Occupancy %, Net Rental Yield, Rent Collection %, Lease Expiry Schedule, Unit Turnover Days.
- Typical Source Systems: Yardi Voyager, MRI Software, Salesforce Real Estate, Oracle Property Manager.
- Operational Value: Automated lease expiry alerts, real-time tenant payment reconciliation, and developer capital expenditure oversight.
Automotive & Dealership Networks
Common Data Challenges: Disconnected Dealership Management Systems (DMS), delayed parts inventory sync, warranty claim tracking, and service bay idle time bottlenecks.
- Relevant Business KPIs: Days to Sell (Vehicle Turn), Service Bay Utilization %, Parts Fill Rate, Warranty Claim Recovery %, Gross Margin by Model.
- Typical Source Systems: CDK Global, Reynolds and Reynolds, SAP Automotive, Salesforce Automotive Cloud.
- Operational Value: Accelerated vehicle inventory turnover, maximized service bay throughput, and transparent parts supply chain visibility.